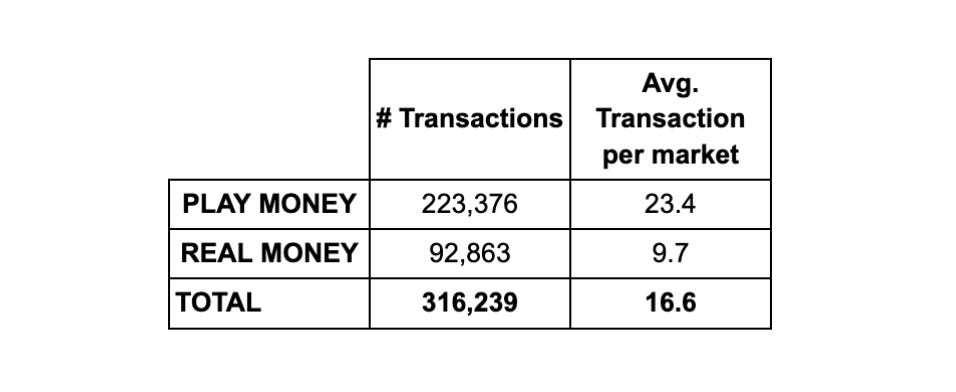
What if you could run two identical prediction markets—one fueled by real-money stakes, the other with play-money—and analyze which one forecasts the world more clearly? That’s exactly what we did at Futuur for over 3 years: same platform, same contracts, same userbase, two ledgers. The result is the cleanest natural experiment yet on whether dollars beat bragging rights when it comes to seeing the future.
By analyzing 316,239 transactions across 19,094 markets, we explore how factors such as transaction volume, amount bet, and market categories influence accuracy. The findings point to a clear conclusion: while both real and play money generate surprisingly accurate forecasts, RM markets consistently outperform PM markets by a small but statistically significant margin.
A Look Back: Previous Studies
Over the past three decades, numerous studies have compared RM and PM prediction markets. While these studies have offered valuable insights, they have also shared some critical limitations:
Platform Differences: Many studies used different platforms for RM and PM markets, making direct comparisons difficult. Variations in platform design and functionality could skew the results.
Category Limitations: Most studies focused on a single category, such as sports or financial indicators, limiting the generalizability of their conclusions.
Small Sample Sizes: The relatively small number of events analyzed in these studies often limited the scope and statistical significance of their findings.
With those gaps in mind, here’s how we built a cleaner test on Futuur.
Our Study: Addressing Past Limitations
Our study directly addresses these limitations by using the Futuur platform, which offers both RM and PM markets under identical circumstances:
Same Platform: Both market types operate on the same web infrastructure, ensuring identical user interfaces, market mechanisms, and user experiences.
Same User Base: The same users can participate in both market types, reducing biases due to different user profiles or behaviors.
Same Markets/Contracts: Both markets are live simultaneously, trading on the same events, allowing for direct comparison.
Large Sample Size: Our analysis includes 19,094 markets (9,547 each for RM and PM) and 316,239 transactions, providing a robust dataset.
Wide Range of Categories: We include various categories, ensuring our conclusions are not limited to specific topics.
By eliminating these disparities, our study ensures the only significant difference is the presence of financial stakes, enabling a more accurate comparison. The full methodology can be found at the end of this article.*
Results and Findings
Real money buys about 6 % more accuracy.
General Brier Score Comparison
A basic statistical analysis of the entire dataset showed that the RM market had a mean Brier score of 0.1573, which is 6.33% lower (better) than the PM market’s mean score of 0.1672. Lower Brier scores indicate more accurate predictions. This difference is statistically significant, confirming that RM markets perform better overall. T-test result of 0.0000034 confirms that difference is statistically significant.
Categories
Across every topic—politics, sports, finance, science, entertainment—real-money markets come out on top.
RM markets were more accurate than PM markets across all five categories analyzed. Notably, politics showed a 50% higher accuracy in RM markets compared to the average of other categories.
Transactions
Fewer than 40 trades? Real money is already twice as sharp; and the edge holds as volume grows.
With 316,239 transactions in total, PM markets had 2.4 times more transactions than RM markets. However, RM markets demonstrated more than double the accuracy of PM markets for low transaction numbers (< 40). RM markets were also generally more accurate at any given number of transactions, reaching a Brier Score of 0.02 at higher transaction volumes, compared to 0.06 for PM markets.
Users
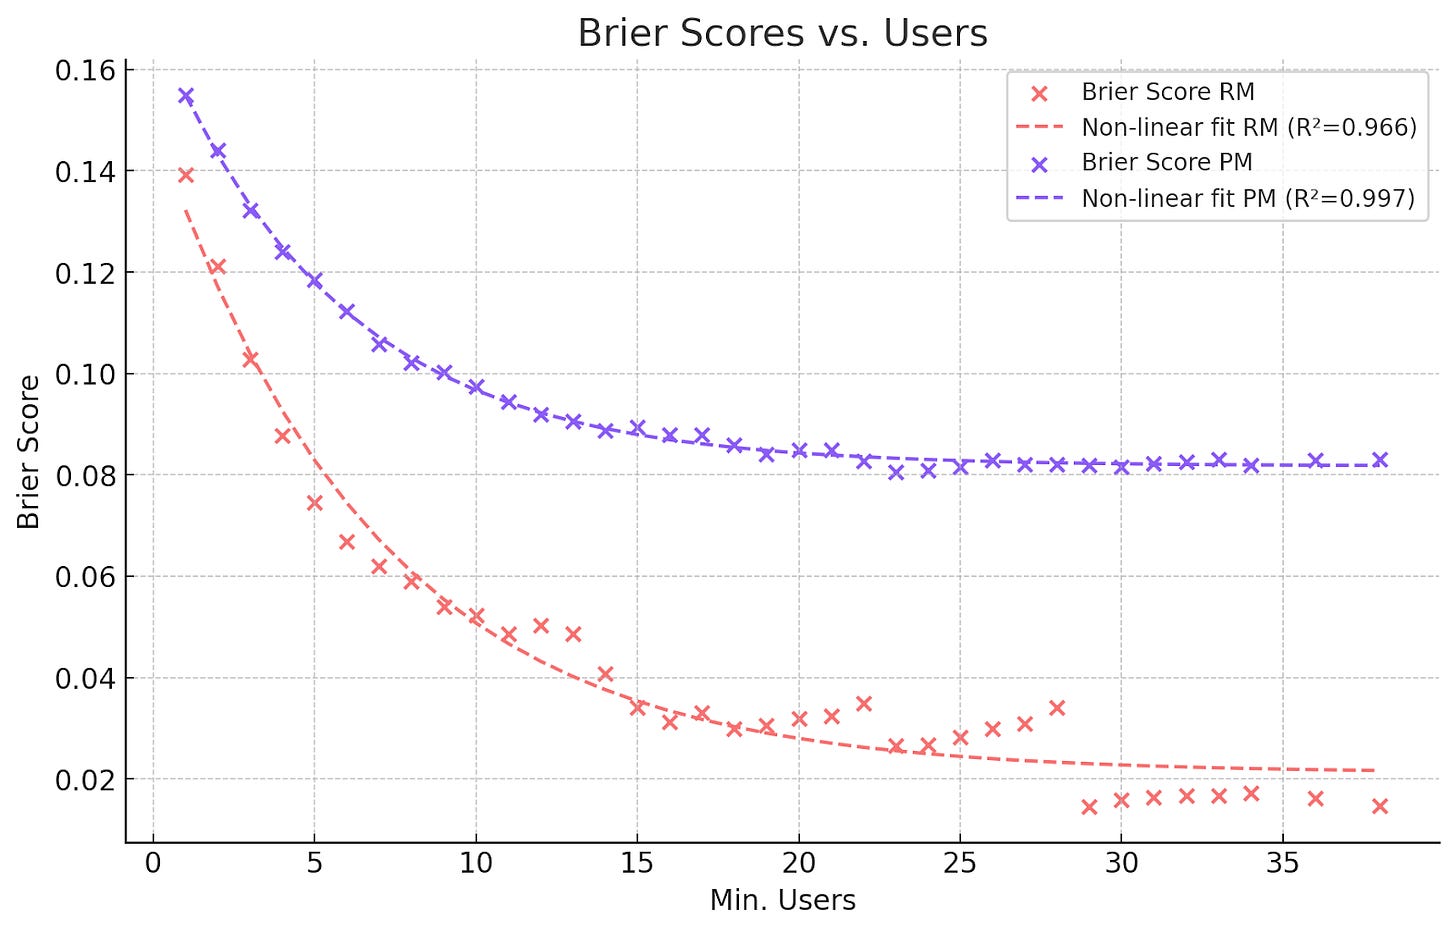
Whether three traders or thirty, the real-money ledger keeps its lead.
This is the accuracy plot for minimum number of users:
RM markets had an average of 3.2 users per market, with 3.0 transactions per user, while PM markets had 14.6 users per market but only 1.6 transactions per user. Again, RM markets showed better accuracy across varying user counts.
Amount Bet
Brier Scores below 0.04 with 100 bucks.
For real-money markets, this is the accuracy plot for the minimum amount bet in the market:
And for play-money markets:
Obviously, there’s no direct comparison to be made between these two. But we can observe that the plateau of negative exponential function is at about 0.04 for PM and 0.02 for RM. Notably, our AMM allowed us to get Briers Scores below 0.04 with USD100.
Sensitivity Analysis
To hit the same error bar, play money needs roughly 5 × the trades and 8 × the traders.
The table highlights the average amount bet, number of transactions, and number of users required for each market type to achieve specific Brier Score thresholds: BS < 0.15, BS < 0.1, and BS < 0.05. Which are in the very accurate range of <0.2. These were the results:
To achieve similar Brier Score thresholds (e.g., below 0.1), PM markets required significantly higher engagement. For instance, PM markets needed 8.2 times more users and 4.6 times more transactions than RM markets.
Final Verdict: Money Talks, But Everyone Should Have a Voice
So, after 316,000 trades, 19,094 markets, and more spreadsheets than we care to admit, the scoreboard is unambiguous: real-money markets beat play-money markets on accuracy, speed, and staying power—by about six percent with one-quarter the effort.
The lesson is as old as the first wager: risk sharpens thought. Put a few dollars on the line and forecasters double-check their priors, trade more deliberately, and stick around long enough to learn from their mistakes.
Yet the story doesn’t end with “cash good, points bad.” Play-money rooms still excel at lowering the velvet rope. They bring in new voices, test wilder ideas, and keep markets humming where regulators fear to tread. We need both ledgers—one for precision, the other for participation—and we need to keep measuring which design choices push each closer to the truth.
Call to action for every prediction platform:
Keep publishing accuracy stats as prominently as you list volume.
Experiment openly with tiny real-stake nudges, better liquidity, or smarter scoring rules—and share the results.
Reward calibration, not just courage. A leader-board that prizes long-run Brier scores can matter as much as dollar signs.
Forecasting is a team sport—accuracy improves when every market, researcher, and trader pulls in the same direction.
Final thought. For two decades the field has asked, “Does money really matter?” Today the evidence says yes—but design matters too. Our study settles a long-standing debate, but it also invites new questions: How can we ensure accuracy remains central in prediction markets everywhere? We believe promoting accuracy through thoughtful financial incentives is essential. Let's collaborate openly, share data transparently, and prioritize truthful forecasts.
Methodology
The study controlled for differences in user interface and event structures by using the same platform for both RM and PM markets, isolating the effect of financial incentives.
Data was collected from January 2020 to April 2024, consisting of 316,239 transactions across 9,547 markets (for each PM and RM). Events included politics, sports, entertainment, and finance, ensuring a broad dataset for analysis. RM and PM markets were available simultaneously, ensuring participants faced identical event conditions.
The analysis focused on four key variables: number of transactions, number of users, amount bet (in RM markets), and event categories. The number of bets per market and the number of users were tracked to evaluate how engagement levels influenced accuracy. Amount bet was recorded only in RM markets, providing insights into the behavioral impact of financial stakes.
The study uses the Brier Score (BS) as the primary metric for measuring prediction accuracy. The Brier Score accounts for both the magnitude of prediction errors and overconfidence, with lower scores representing more accurate predictions.
For analysis, Brier Scores were aggregated into bins based on various minimum thresholds (e.g., transactions, users) to smooth out noise and show clearer graphs. Each data point on the resulting plots reflects the average Brier Score for all markets exceeding the specified minimum threshold. To maintain rigor, the smallest bin size consisted of at least 50 markets.
Negative exponential functions were applied to fit the data, capturing the relationship between transactions, users, and accuracy. This helped identify diminishing returns as engagement increased.
Statistical tests, specifically t-tests and F-tests, were applied only for the general comparison between RM and PM markets, not in the variable-specific analysis. Confidence intervals and standard errors were calculated to assess the precision of the general comparison.
A sensitivity analysis explored how transactions, users, and amount bet influenced the ability of RM and PM markets to reach specific Brier Score thresholds. This was crucial for understanding what level of engagement is required to reach a desired accuracy.
A couple points to cover
Self-selection bias: RM markets may attract inherently more confident or experienced forecasters willing to risk capital, whereas PM users might be hobbyists or novices. It’s worth emphasizing that the very act of risking real capital screens for more experienced or motivated traders. This “selection effect” isn’t a statistical annoyance to be corrected—it’s one of the channels by which RM markets sharpen forecasts. In practice, RM markets both incentivize careful probability assessment and curate a participant pool inclined toward disciplined, data-driven trading. Recognizing selection as a feature, not just a confounder, helps us appreciate that RM’s edge derives as much from who shows up as from how they bet.
Low brier scores: It’s important to note our low Brier scores partly reflect the fact that evaluations were conducted immediately before event resolution. Naturally, cumulative information enhances accuracy as predictions approach resolution, benefiting from the latest available insights. In any case, we don’t consider we have a specially higher number of cumulative-information markets than other major platforms, so Brier Scores should be comparable. Additionally, our study exclusively used an Automated Market Maker (AMM), instead of traditional order book, enabling us to achieve high accuracy even at relatively low transaction volumes. The AMM mechanism ensured consistent liquidity and allowed for accurate pricing without relying on high trading volumes alone.
References
Slamka, C., Luckner, S., Seemann, T., & Schroder, J. (2008). An empirical investigation of the forecast accuracy of play-money prediction markets and professional betting markets. ECIS 2008 Proceedings, 236. Retrieved from http://aisel.aisnet.org/ecis2008/236
Servan-Schreiber, E., Wolfers, J., Pennock, D. M., & Galebach, B. (2004). Prediction markets: Does money matter? Electronic Markets, 14(3), 243–251. https://doi.org/10.1080/1019678042000245254
Poblete, J., & Diemer, S. (2010). Real-money vs. play-money forecasting accuracy in online prediction markets – Empirical insights from iPredict. The Journal of Prediction Markets, 4(3), 21–58. Retrieved from https://www.ubplj.org/index.php/jpm/article/view/479
Rosenbloom, E. S., & Notz, W. (2006). Statistical tests of real-money versus play-money prediction markets. Electronic Markets, 16(1), 63–69. https://doi.org/10.1080/10196780500491303


